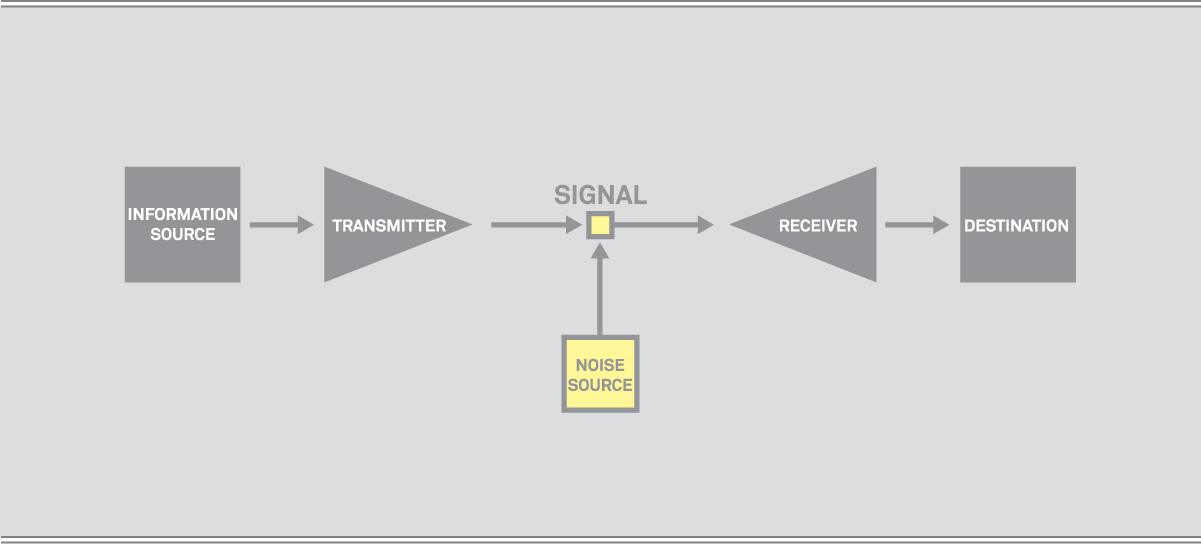
In visual communication design, there are 2 forms of visual disruptions that compromise a message. We’ll call these disruptions, visual noise. The first kind is the noise in the channel that delivers the visual message, and the second is the noise in the visual code (message) being delivered through that channel. We are going to discuss the first instance – channel noise, diagrammatically revealed in figure 1.

Figure 1. Claude Shannon’s diagram showing a communication channel and its source of channel noise within the signal.
(adapted from Shannon, 1948, p. 381[1])
Consider visual channel noise to be everything up to the delivery of the visual message. In other words, if you are looking at a design, and you can easily tell you are reading the words “channel noise compromises message delivery”, then the channel noise is low. If the words are harder to distinguish, the channel noise is high, as shown in figure 2.
 Figure 2. A textual message may contain visual noise, making the code hard to decipher.
(Text: Mesquite Medium)
This doesn’t just occur in words or letterforms – it happens to all the visual elements on a page or screen– and not just the elements themselves, but noise can be generated as visual elements combine and interact in any visual space. Rather than discussing channel noise as an abstract concept, let’s consider concrete examples of channel noise in text, graphic devices, and complete layouts of information.
CHANNEL NOISE IN TEXT
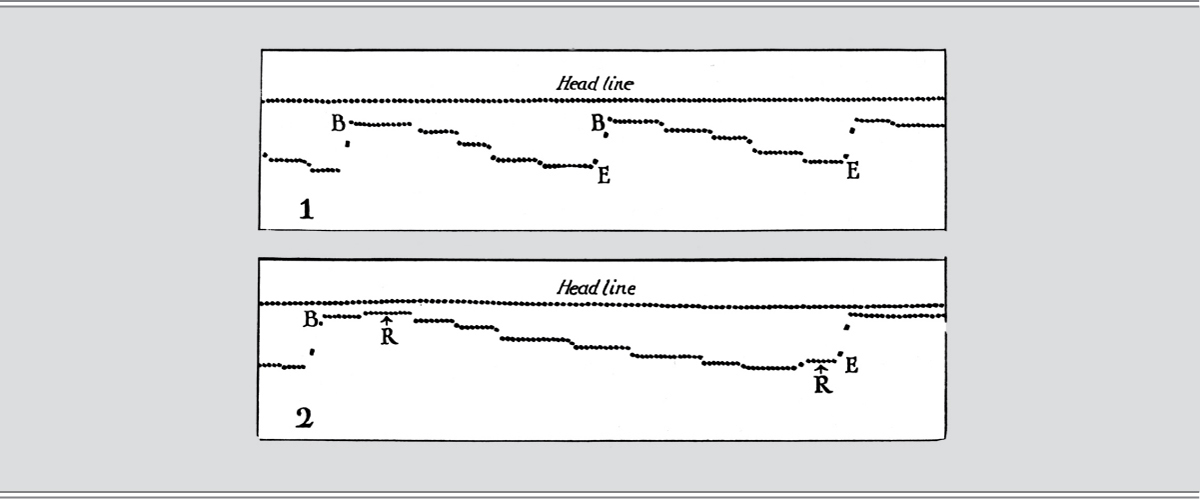
For over 30 years, the American psychologist Miles Tinker studied text legibility and performed many forms of reading tests, using various methods of research. One of Tinker’s main methods tested perception – how the visual channel behaves. Tinker’s research of eye movements and pauses when reading, is direct evidence of the physiological generation of channel noise. Tinker measured the frequency of eye fixations against reading speed for many different text layouts and found a correlation: more fixations means slower, more difficult reading, as shown in figure 3. Proper typesetting, type choice and type layout allows the reader to glance more easily, more efficiently, and less often [2].
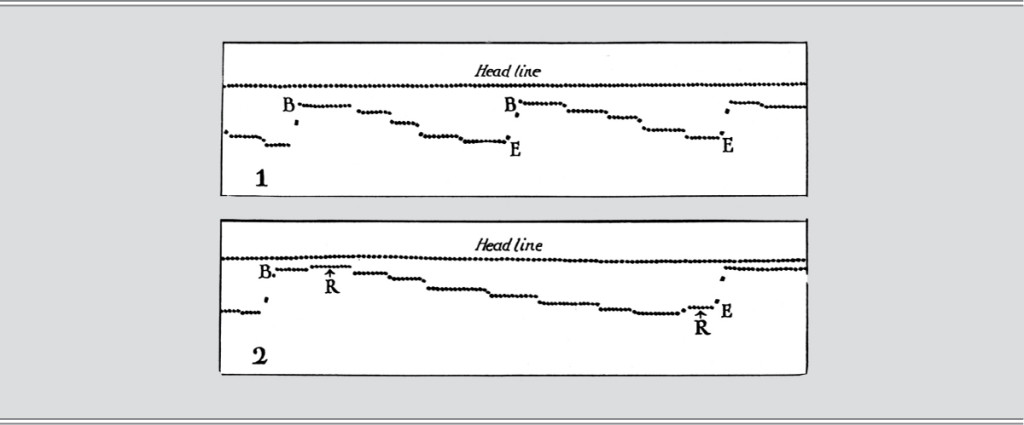
Figure 3. Eye movement plots of a reader easily reading 2 lines of text (top) and a compromised reader reading 1 line of text (bottom).
(Tinker, 1963, p. 24)
The diagram above is one of many indicators of visual channel noise in text. Other researchers have approached this phenomenon through comprehension testing – where subjects read tests or articles and answer questions about the content. The researcher then analyzes the results to see which typographic features promoted better test scores. In this approach as well, typography has proven to affect reading comprehension, and when poorly used, can compromise visual message transfer.
CHANNEL NOISE IN GRAPHIC DEVICES
Edward Tufte has developed several principles that describe how channel noise is generated within graphics and diagrams. One of these principles is data ink ratio.
Data-ink ratio is the ratio of information to non-information in a visual message. Most graphics don’t have a 1:1 ratio of data ink to graphic ink. If they did, it would mean every bit of the visual message represented pure data. Some extra ink is usually used. An example of extra ink would be a grid behind a bar chart [3].
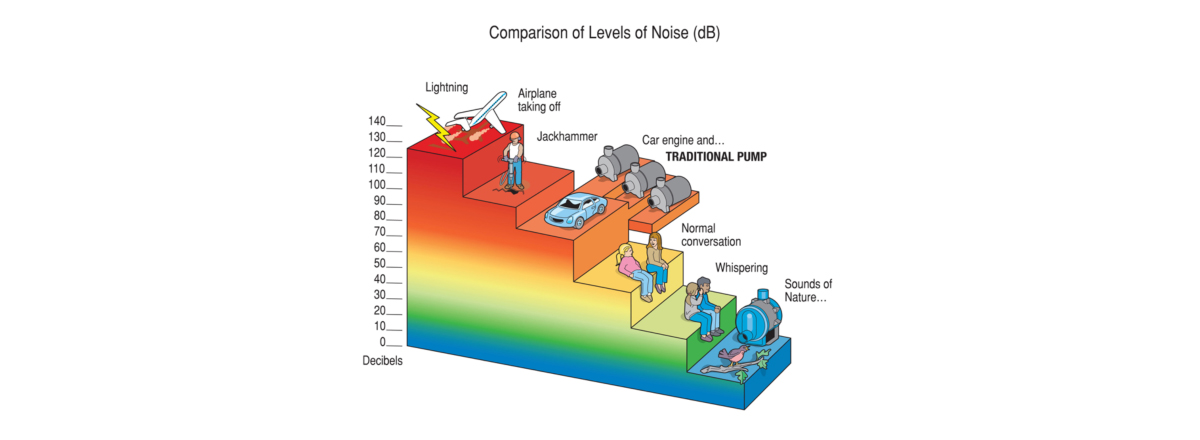
The effect of too much non-information in a data graphic is that the non-information distracts the message receiver from clearly seeing the data. In regards to visual channel noise, the channel noise begins to compete with, or overwhelm the visual message, as seen in figure 4. The same principle may apply to complete designs, where superfluous imagery overcomes the message.

Figure 4. Non-information can overwhelm valuable information in data graphics.
(Retrieved November 8, 2010 from: http://www.syllent.com/media.html)
This suggests that both the amount of non-information, and the form of the information presented, as discussed in Miles Tinker’s type research findings, can create visual channel noise, compromising visual communication design effectiveness.
CHANNEL NOISE IN GRAPHIC LAYOUTS
Maria Dos Santos Lonsdale performed various tests on examination layouts in 2006–2007. Her basic premise was that examination subjects were under pressure to read information accurately and quickly, without error, and that she could test design performance by comparing the test scores of these candidates using different examination layouts.
Lonsdale prepared 2 layouts of examination materials. The first set was designed conforming highly to comprehensibility guidelines and was spaciously designed and easy to read. The second represented the standard existing test layouts in use at the time.
The studies showed that participants could read the high-level material faster, with more ease, answering questions more accurately. The participants’ consistently described space as their preferred design feature. They referred to the space between paragraphs and lines of text, and felt these allowed them to access information better [4].
This research suggests that visual channel noise is created when a jammed layout confuses the eye, yet it is natural to elevate some content above other content, stress important points, clarify others, and draw illustrative diagrams. But as Edward Tufte notes, items on a page may interact negatively, which means they mutually create visual noise [5].
WHO MINIMIZES VISUAL CHANNEL NOISE?
When we talk about visual channel noise, the channel we are discussing is eyesight. Most of the noise in a visual design is not technical in origin, such as poor quality printing, or a low-resolution pdf file, but is actually created by the designer. Designers create visual channel noise by choosing inappropriate typefaces, setting type poorly, using marginal images or poorly constructed diagrams where the information is hard to discern, or by combining elements that interfere with each other in the visual space the design inhabits. It is therefore up to designers to manage visual channel noise.
This post has been a brief introduction to visual channel noise. The concept of channel noise is important – rather than giving us thousands of great ideas of what we should do to make better designs – the concept of channel noise gives us direction on what not to do. It shows us where we compromise visual messages, and it can give us the mental tools we need to make visual communication better.
[1] Shannon, C. E. (1948). A mathematical theory of communication. The Bell System Technical Journal, 27
[2] Tinker, M.A. (1963). Legibility of print. Ames, IA: Iowa State University Press.
[3] Tufte, E.R. (2001) The Visual Display of Quantitative Information, 2nd Ed., Cheshire, CT: Graphics Press.
[4] Lonsdale, M.dos S. (2007) Does typographic design of examination materials affect performance? Information Design Journal, Vol. 15, 2, 113-137, John Benjamins Publishng Co.
[5] Tufte, E. R. (1990). Envisioning information. Cheshire, CT: Graphics Press.


Share this
Posted in theory. Leave a comment.